Extending LLDB to debug applications that span CPUs and GPUs
Engineering teams have introduced a vendor neutral accelerator plugin architecture for lldb-server to handle modern workloads that move back and forth between central processing units and graphics processing units.
2 min read, Tuesday, 10 November

Modern applications that rely on artificial intelligence rarely execute in a single place. A workload frequently begins in a high-level framework before moving between native central processing unit code and kernels running on a graphics processing unit. When software bugs cross these hardware boundaries, developers need a way to understand both the host application and the device at the same time. Doing this is significantly more difficult than attaching a conventional debugger to a single process.
Key facts
- Offload Architecture
- gfx950
- Target Architecture
- amdgcn-amd-amdhsa--gfx950
- Host Architecture
- x86_64-unknown-linux-gnu
The challenge of heterogeneous debugging
Traditional debuggers assume that a single process has one architecture and a consistent view of threads, registers, and memory. Graphics processing units challenge every part of that assumption. A host process might run on an x86-64 architecture while its kernels use an entirely different instruction set. Furthermore, graphics processing units can expose thousands of execution lanes that do not map cleanly onto traditional thread models.
Historically, hardware vendors built separate, dedicated debuggers like AMD's ROCgdb and NVIDIA's CUDA-GDB. While powerful, these tools require common capabilities to be implemented repeatedly. To solve this duplication, engineers have developed a common accelerator plugin architecture inside lldb-server — a companion process that performs low-level debugging operations.
Two targets in one session
The new architecture represents the central processing unit and the accelerator as separate targets. Each target maintains its own architecture, registers, address space, and execution state. To the debugger, these targets remain independent, but they appear together in a single lldb or integrated development environment session.
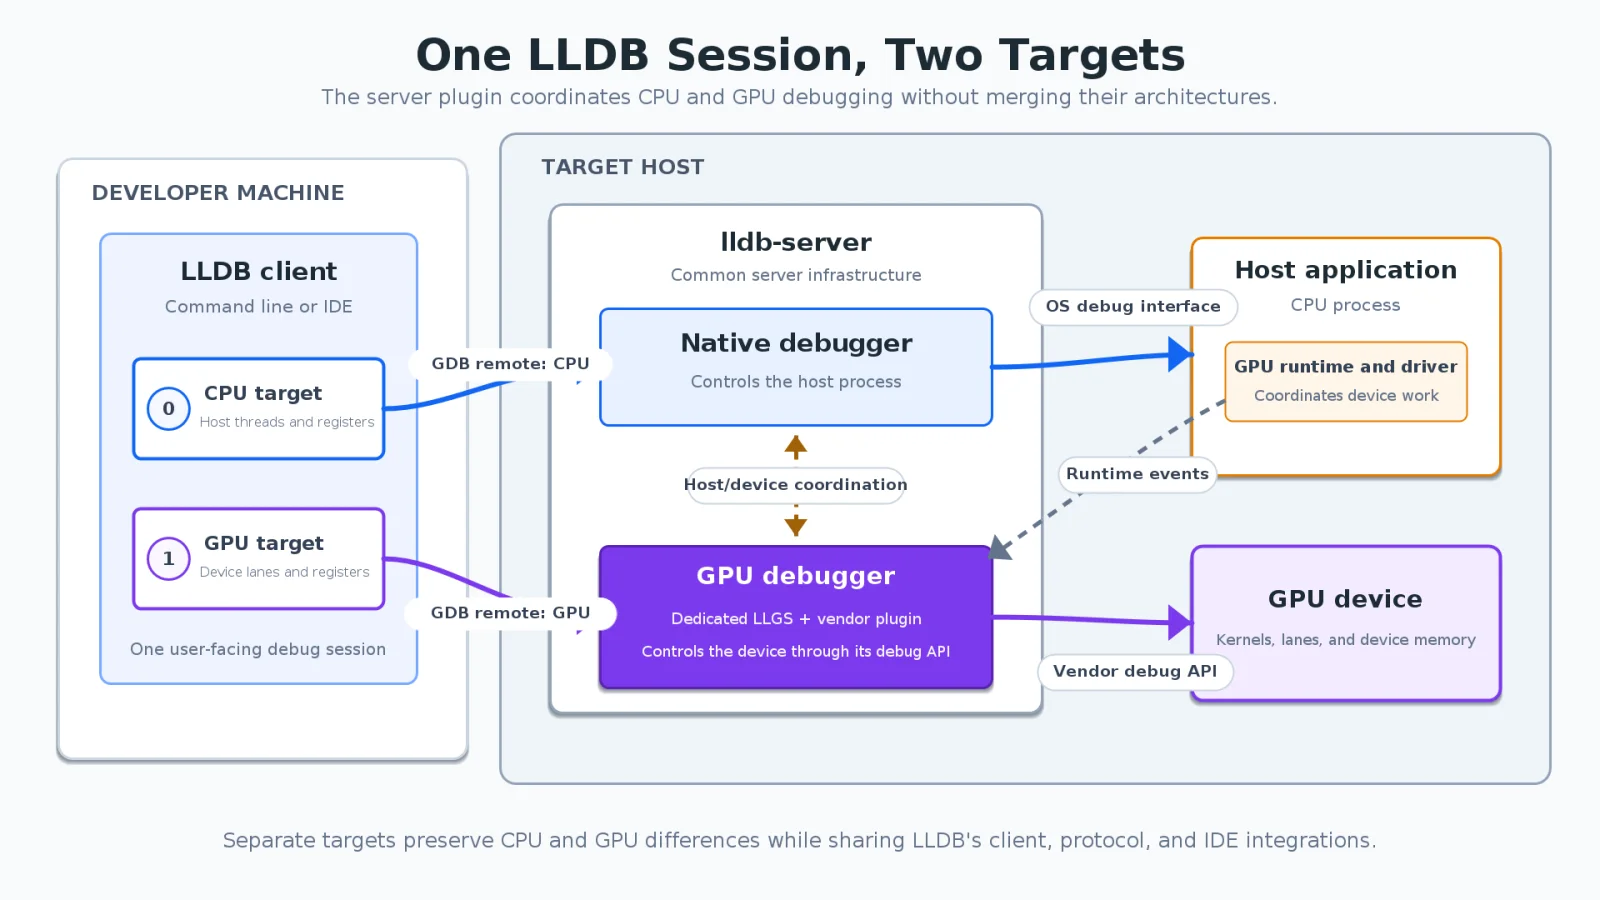
A hardware-specific backend translates the device debugging application programming interface into concepts the debugger already understands, such as modules and stop reasons. This approach keeps the core client vendor-neutral while allowing manufacturers to manage their own driver stacks. Developers can now trace complex execution flows across hardware boundaries without forcing incompatible concepts into a unified process model.
Source: Original announcement
Worth a read?


Comments